 FACTS & TRENDS
- The abrupt topography of the bedrock reef at Mavericks causes wave energy to converge over the reef, causing the wave to rapidly slow down, shorten in length and substantially increase in height.
- The seafloor imaged off Pillar Point and Half Moon Bay is comprised of sedimentary rocks formed during the Pliocene, some 5.3-1.6 million years ago.
- This mapping is part of a larger effort to map nearshore waters of California initiated by the California Coast State Waters Mapping Project.
The California Ocean Protection Council and National Oceanic and Atmospheric Administration (NOAA) National Marine Sanctuary Program recently announced findings revealing unprecedented detailed imagery of the seafloor, including in areas of the Monterey Bay National Marine Sanctuary off Half Moon Bay, where the famed “Mavericks” waves are among the largest in the Continental United States.
The California Coast State Waters Mapping Project allows scientists for the first time to see highly detailed, three-dimensional images of the seafloor off California’s coast. New data illustrates the rugged seafloor conditions surrounding Mavericks more clearly and helps better explain ocean ecosystems and underwater activities like large waves and earthquakes.
“This type of cutting-edge research is essential to understanding the unique aspects of our national marine sanctuaries, enabling better ecosystem-based management,” said Gulf of the Farallones National Marine Sanctuary Superintendent Maria Brown. “The marine sanctuary will use these images to educate future ocean scientists and foster citizen stewardship.”
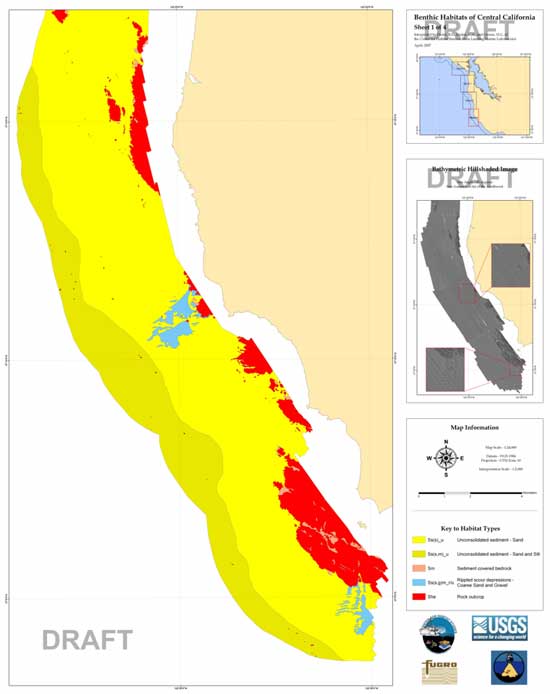
Using advanced sonar equipment called shipboard multibeam echo sounders and aerial light detection bathymetric sensing instruments, detailed underwater pictures were produced. The images distinguish critical underwater habitats and highlight the faults, chasms, fissures, crevices, and pinnacles on the sea floor. Scientists and resource managers will use the information to identify potential biological hot spots to aid their understanding of the highly productive, diverse undersea ecosystem along the California coast.
“This research is extremely valuable in identifying areas important to the California Marine Life Protection Act process and could simultaneously help to predict seismic hazards along California’s coast,” said Secretary for Resources Mike Chrisman, chair of the Ocean Protection Council.
Also significant is the survey’s charting of navigational hazards such as hidden reefs and sunken obstacles. Knowing where hazards are located is essential for the safety of vessels that use these waters each year. This is the first time scientists have been able to show the shallow nearshore reef in such detail.
Geologic hazards along the seismically active California coast have also been identified. The survey documents the position and physical features associated with the marine segments of the San Gregorio fault in the Half Moon Bay area, a major active fault within the San Andreas Fault System.
Partners involved in this mapping project are listed below.

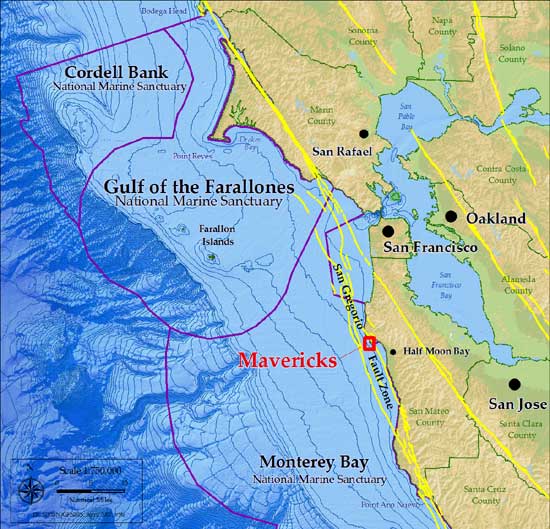
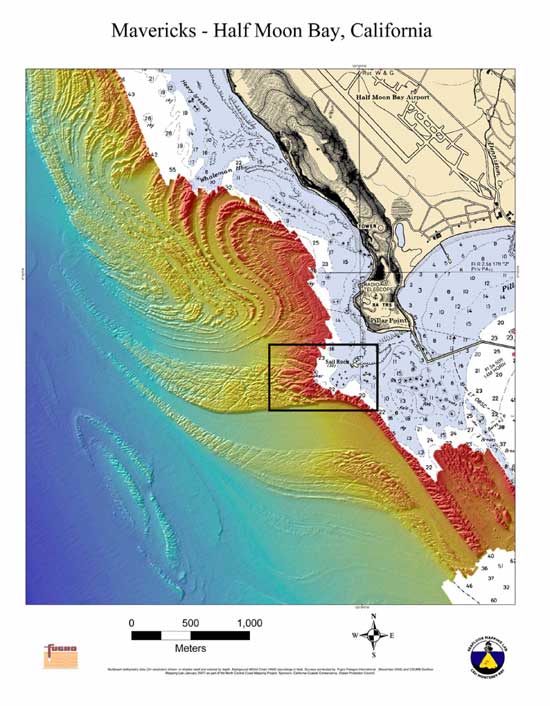
The seafloor imaged off Pillar Point and Half Moon Bay is comprised of sedimentary rocks formed during the Pliocene, some 5.3-1.6 million years ago, and more modern sediments, primarily sand. Erosion by waves and currents have caused the weaker, less resistant beds to erode, leaving the stronger, more resistant beds elevated higher above the adjacent sediment-covered seafloor, resulting in the alternating striped pattern of higher ridges and lower troughs seen on the seafloor today. Movement along the San Gregorio fault, which comes ashore in Pillar Point Harbor (see Figure 1b), has folded and uplifted the sedimentary rocks, causing the twists and turns in the seabed today, along with the headland at Pillar Point and the prominent east-west trending bedrock reef that is exposed above the water at Sail Rock.
Download full-size image (752 KB PDF)

The dominant wave direction off the central coast of California during most of the year is from the northwest. These waves propagate over the much gentler topography to the northwest of Sail Rock and are generally too small to shoal and break at Mavericks. Sometimes during the winter months, however, strong North Pacific storms generate large, long-period waves from more westerly directions that shoal and break over the bedrock reef just to the east of Sail Rock. The abrupt topography of the bedrock reef causes wave energy to converge over the reef, causing the wave to rapidly slow down, shorten in length and substantially increase in height relative to the areas just to the north and south of the east-west trending reef. This interaction of the geology and oceanography is what makes the wave at Mavericks so spectacular compared to many other locations along central California.
Download full-size image (92 KB PDF)
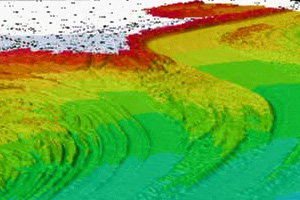
The 3-D image is color-coded by depth: the blue and green areas are deeper than the areas in yellow and red. You can see how rugged the sea floor is in this area with lots of ridges, valleys, chasms, and pinnacles.
The new data indicates that Mavericks is above a portion of the rocky reef that is shallower than the surrounding rock. As a wave front approaches the shoreline and progressively enters shallow water, it becomes compressed and grows taller. The ridge promontory also has the effect of focusing wave energy and the wave height rapidly increases, creating a huge wave compared to adjacent areas. About here (the highest red we see), the wave becomes unstable and breaks. In fact, the data collection stopped here because the rough sea conditions made it too dangerous for the scientists to operate their boat!
Although interesting for explaining the mystery of Mavericks, scientists and resource managers will be using this data to identify hazards to navigation, classify different habitat types, locate biological hot spots, and study the San Gregorio fault.
The project is a collaboration of the following organizations:
(Click a logo to visit the organization’s website)
![]()
![]()
![]()
![]()
![]()
![]()
![]()
![]()
![]()