 MPA Monitoring Map
The SIMoN MPA Monitoring Map is a Google Maps application designed to facilitate coordination amongst investigators to understand and manage State Marine Protected Areas in the region. Contact Steve Lonhart at (831) 420-3661 or steve.lonhart@noaa.gov for questions, comments, or assistance.
Water Quality Viewer
 The SIMoN Water Quality Monitoring Viewer is a Google Maps application that provides the locations, measurement types, and data access information for water quality monitoring programs in the region. Contact Bridget Hoover at (831) 647-4217 or bridget.hoover@noaa.gov for questions, comments, or assistance.
Sanctuary Characterization & Image Display (SCID)
 SCID provides rapid dissemination of Sanctuary characterization information (including video imagery, frame grabs, and ultimately scientific data) to Monterey Bay National Marine Sanctuary (MBNMS) staff, researchers, and the public using a user-friendly graphical interface.
Central California Marine Habitat Viewer
 This SIMoN viewer provides GIS data layers on the various habitats found in the Monterey Bay, Cordell Bank and Gulf of the Farallones national marine sanctuaries.
West Coast Observatories Viewer
 This Internet map application provides a common, geospatially referenced view of coastal and ocean observations in and around the West Coast National Marine Sanctuaries. Observation data are generally grouped into two categories: 1) near-real time observations; 2) long term observations. Near real time observations include marine and land surface weather data acquired from the Meteorological Assimilation Data Ingest System (MADIS). Data are assimilated into a geospatially enabled database on an hourly basis and stored for 48 hours. Long term observations include imagery products created for a three month period.
CeNCOOS Data Portal
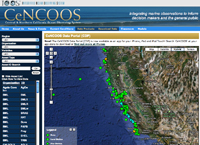 The CeNCOOS Data Portal (CDP) allows you to do the following: 1) Examine real-time plots or tables of six ocean and weather variables from ocean and coastal assets; 2) Observe real-time ocean and coastal images through webcams; 3) Generate historic data plots or tables in 30-day blocks (date range depends on asset); 4) Download data from assets for a variety of uses: Microsoft Excel or text editors (CSV/TSV), Google Earth (KML) and machine-to-machine access (XML).”